
Monthly Correlation Charts: Soybean Meal (SM)
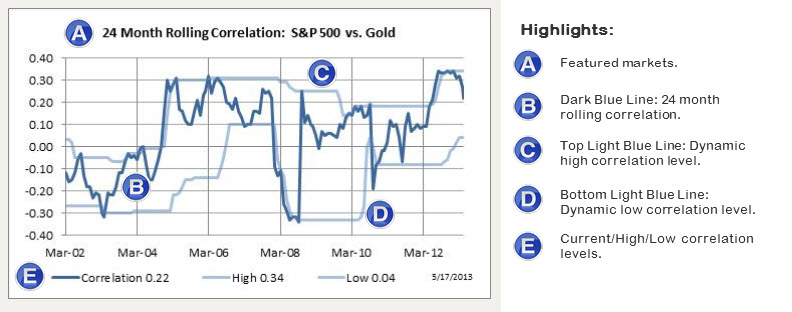
It’s all about the charts … and we have a lot of them. Our correlation charts provide a historic rolling perspective on the relationship between Soybean Meal and 40 other markets. The sample chart shown below (Tab 1), illustrates the 24 month rolling correlation, represented as the dark blue line, clearly shows a continually changing relationship between the markets. Sometimes the relationship is strong while at other times it’s weak. The point is … markets move … as such so do their correlations. Thus we need to continually adjust our interpretation as to what is considered to be a high or low correlation level. To assist in this dynamic interpretation, each chart has outer bands of light blue lines (top & bottom) to reflect true high/low correlation levels. Current levels are also posted at the bottom of the chart.
For current correlation charts for Soybean Meal … scroll down to the individual sectors covering a total of forty global futures markets.


Here are a few basics on how to interpret our correlation charts.
• Each correlation study is based on the market’s % monthly return figure and not price.
• The dark blue line plots the 24 month rolling correlation from mid 2003 to the current month.
• The lighter blue lines plot dynamic high/low correlation levels that adjust to current market conditions.
• A correlation of +1 signifies a direct relationship while a correlation of -1 signifies an inverse relationship.
Current Monthly Correlation Breakdown
With a long list of markets to scroll through this section offers a quick visual of markets that are currently in a high or low correlation stage with the featured market. Note markets that recently moved into a high or low correlation stage are highlighted at the end of the bar with an “x”.
Currency Sector


Energy Sector


Equity Sector


Grain Sector



Interest Rate Sector


Meat Sector


Metal Sector


Soft Sector


