Intermarket Analysis: S&P 500 Index vs RBOB Gasoline
Intermarket Analysis looks at the relationship between two markets … in this case the S&P 500 Index and RBOB Gasoline. When the two markets have a wide disparity between their Value Added Weekly Index (VAWI) equity charts the markets have a tendency to reverse course. This change in course can be short-term in nature or possible the start of major new trends for each market. There, of course, is always the strong possibility that the markets will complete disregard their intermarket relationship and continue to move in their current directions. Hence never depend upon a single form of analysis.
Chart Review:
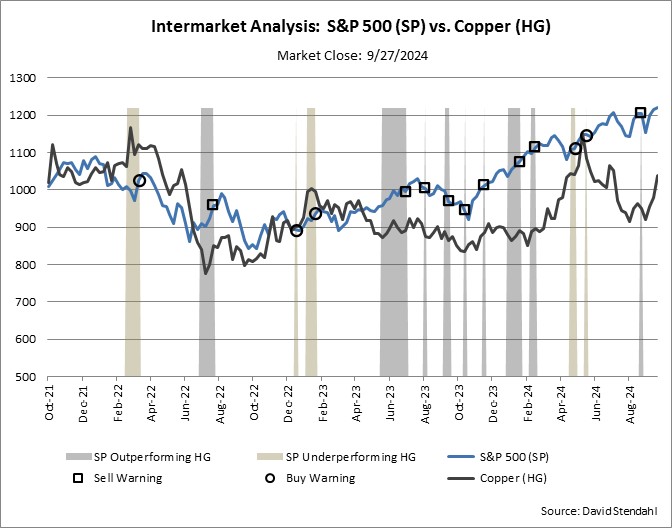
When the S&P 500 Index under-performs RBOB Gasoline the chart will turn a light tan. This indicates the two markets are in an extreme environment having moved to far apart from one another. This environment could last for short period or go on for an extended period. Either way, eventually the spread between the markets will begin to shrink. Once this occurs a “buy warning” will be triggered, which will appear as a circle on the chart. This “buy warning” is just a warning … not a call to action or a “buy recommendation”. It simple indicates that the S&P 500 Index is no longer under-performing RBOB Gasoline. This change could potentially last for a few weeks or possible a few months.
The opposite phase occurs when the S&P 500 Index outperforms RBOB Gasoline which will turn the chart a light gray. This indicates that the performance of the S&P 500 Index is well ahead of RBOB Gasoline on a relative basis. Similar to the under-performing phase … out performance between the markets could last for short or long periods of time. Once the spread between the two markets slows a “sell warning” will trigger as a square on the chart. This “sell warning” is just a warning … not a call to action or a “sell recommendation”. It simple indicates that the S&P 500 Index is no longer strongly outperforming RBOB Gasoline. This phase change could potentially last for a few weeks or possible a few months.
As always … trade at your own risk and analysis.
S&P 500 Index and RBOB Gasoline Intermarket Relationship:

Note: These are NOT buy/sell recommendation they are simple environmental warning based on performance changes between the markets.
S&P 500 Index Intermarket Analysis Flip-board