
Market Personality · Report
FV — 5-Year Treasury Note
FV is in a mean-reverting state — moves fade, ranges hold, breakouts get sold. This is the environment where fading extremes historically works. We built this read from 37 years of FV daily data.
Archetype: Quiet Range
Archetype verdict
5-Year Treasury Note is a Quiet Range market right now — the archetype label is how the full 37-year read of its personality rolls up into one tag. Range-bound and clean. Fade extremes with small size; low-conviction regime for most systems.
Three readings drive that call (all scored against FV’s own history, not against other markets):
- Volatility: Calm — low — unusually quiet for this market
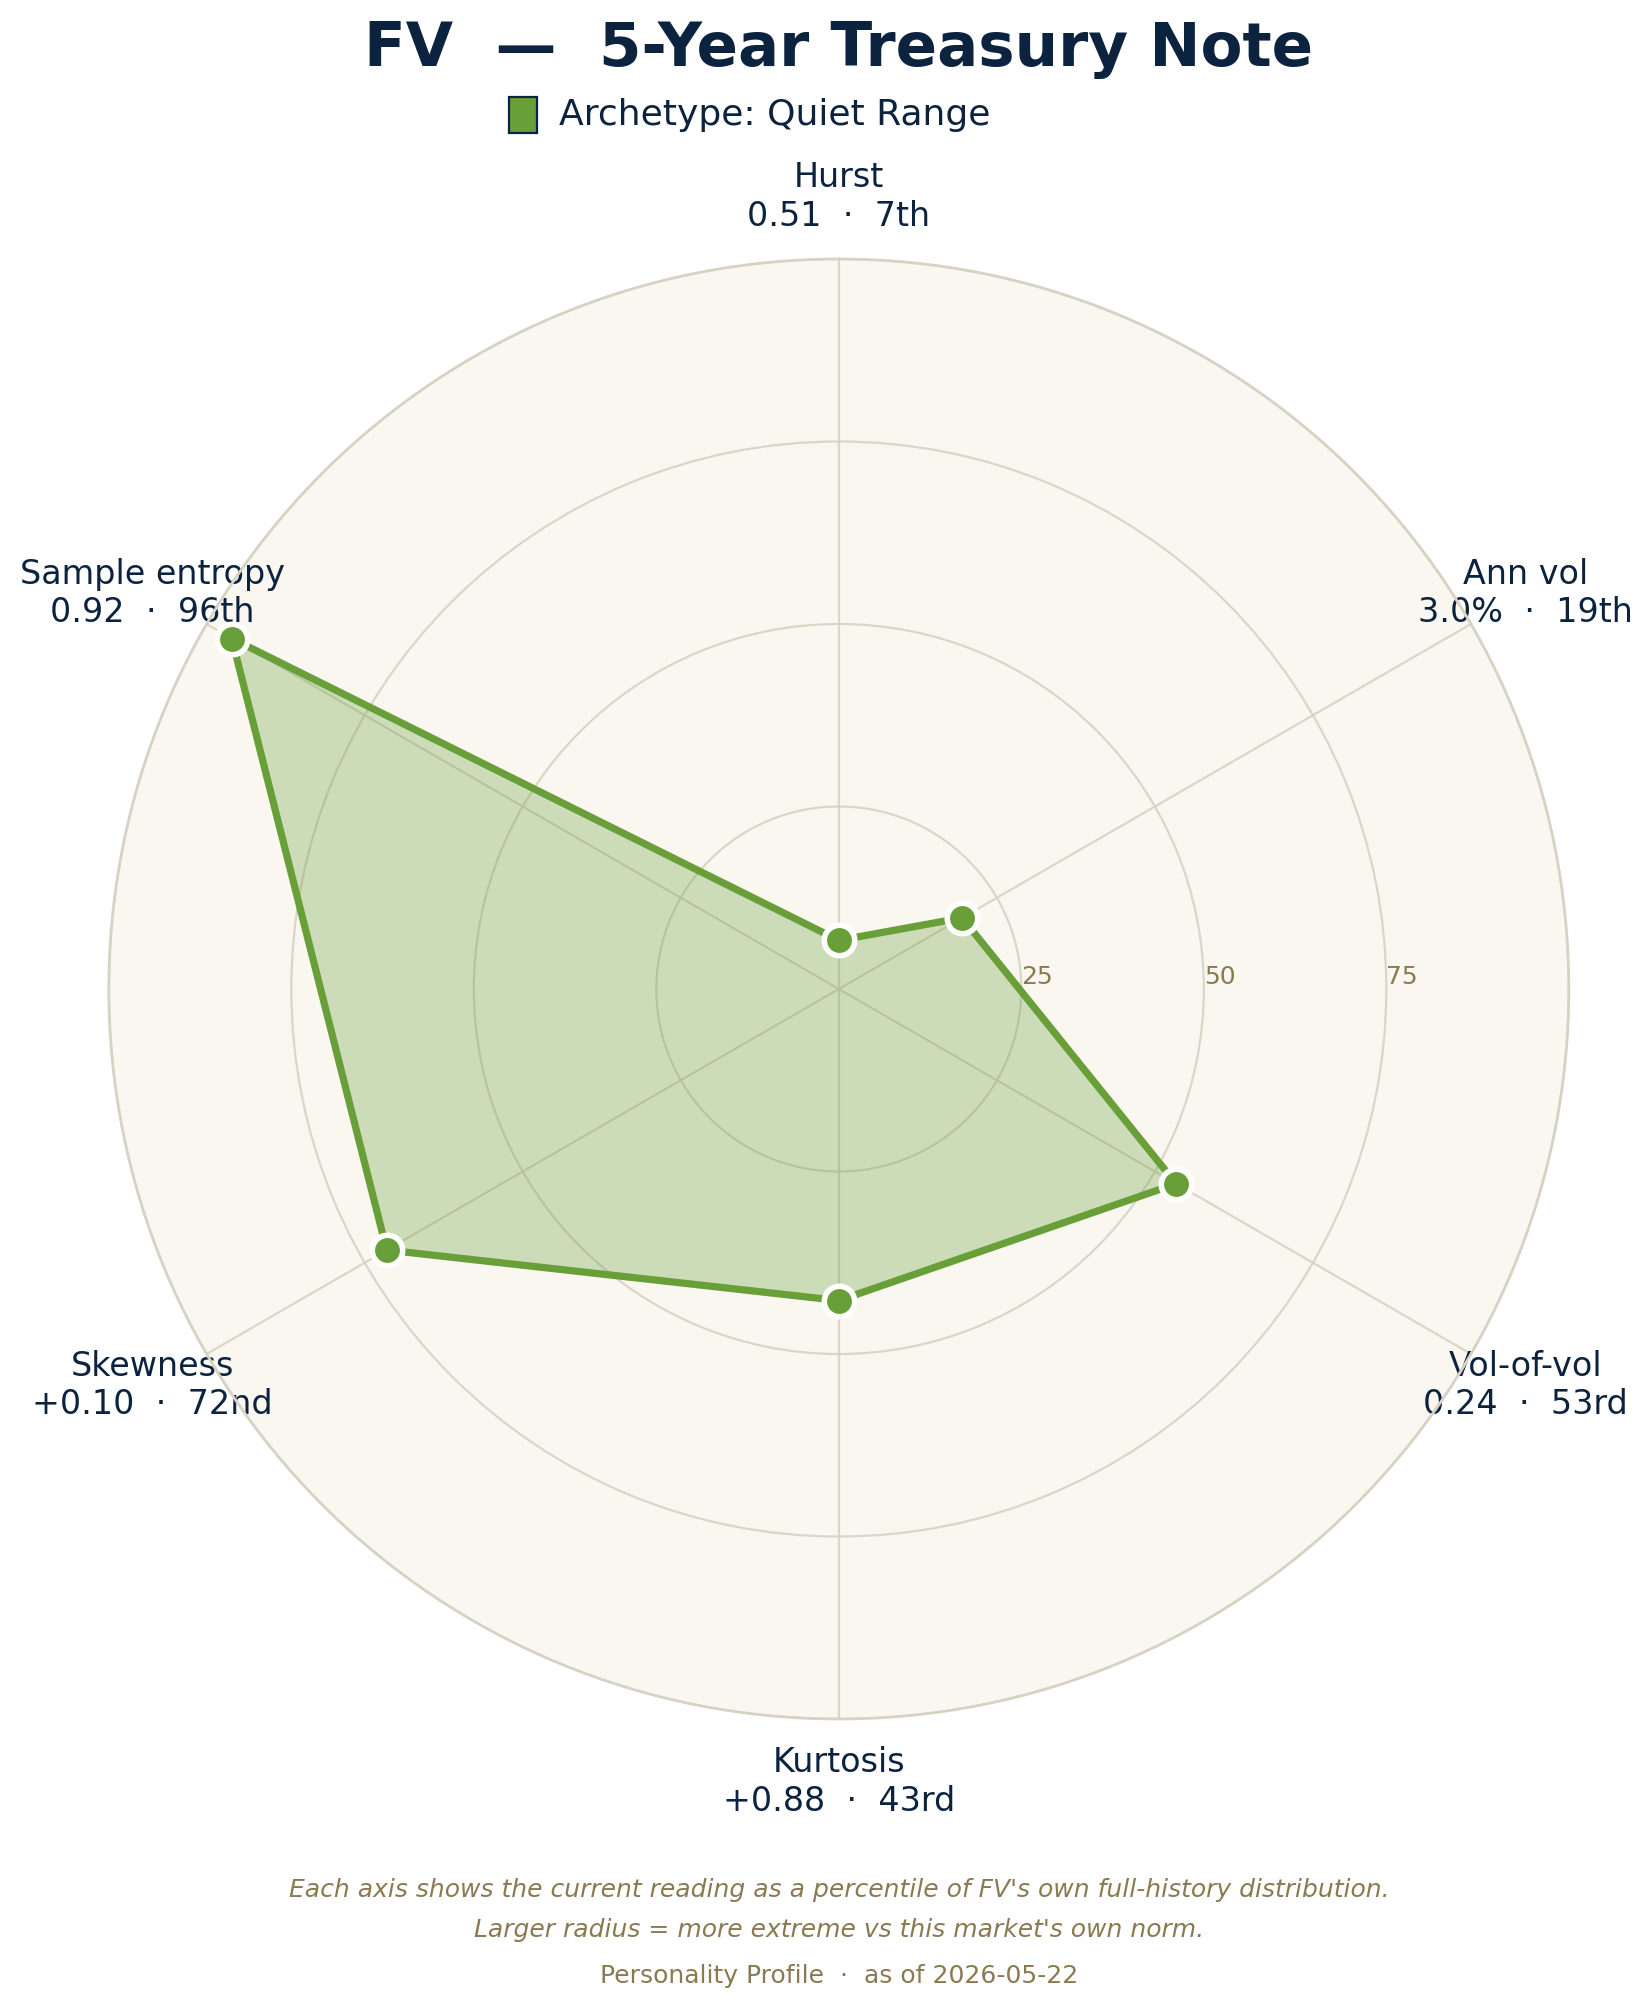
- Trend strength: Mean-Reverting — 7th percentile — medium-term persistence runs low (shorter memory)
- Tail risk: Clean — 43rd percentile on kurtosis — no fat-tail shocks piling up
- If you’re a mean-reversion trader: This is your environment. Range-fading and overbought/oversold signals carry more weight here than during trend regimes.
- If you’re a trend trader: Breakouts get faded. Wait for a Hurst move above 0.5 or a vol-regime shift before committing to trend systems.
- If you’re sizing for risk: Vol is in the 19th percentile — unusually quiet. Standard sizing is fine; be aware that quiet vol regimes can end abruptly.
DNA radar
This radar chart is FV’s fingerprint today. Each of the six spokes measures one trait of the market — how strongly it trends, how volatile it is, how fat its tails are, and so on — ranked against FV’s own 37-year history. A big spike on one spoke means FV is unusually strong on that trait right now. The overall shape is the market’s personality at a glance.
5-year trajectory
Today’s radar is only one frame. This strip shows four frames — 5 years back, 2 years back, 1 year back, and today — so you can see FV’s personality evolve over time. All four use the same yardstick (FV’s full history), so any change in the shape is a real change in the market, not a change in how we’re measuring it. The label under each frame is the archetype we called at that time.
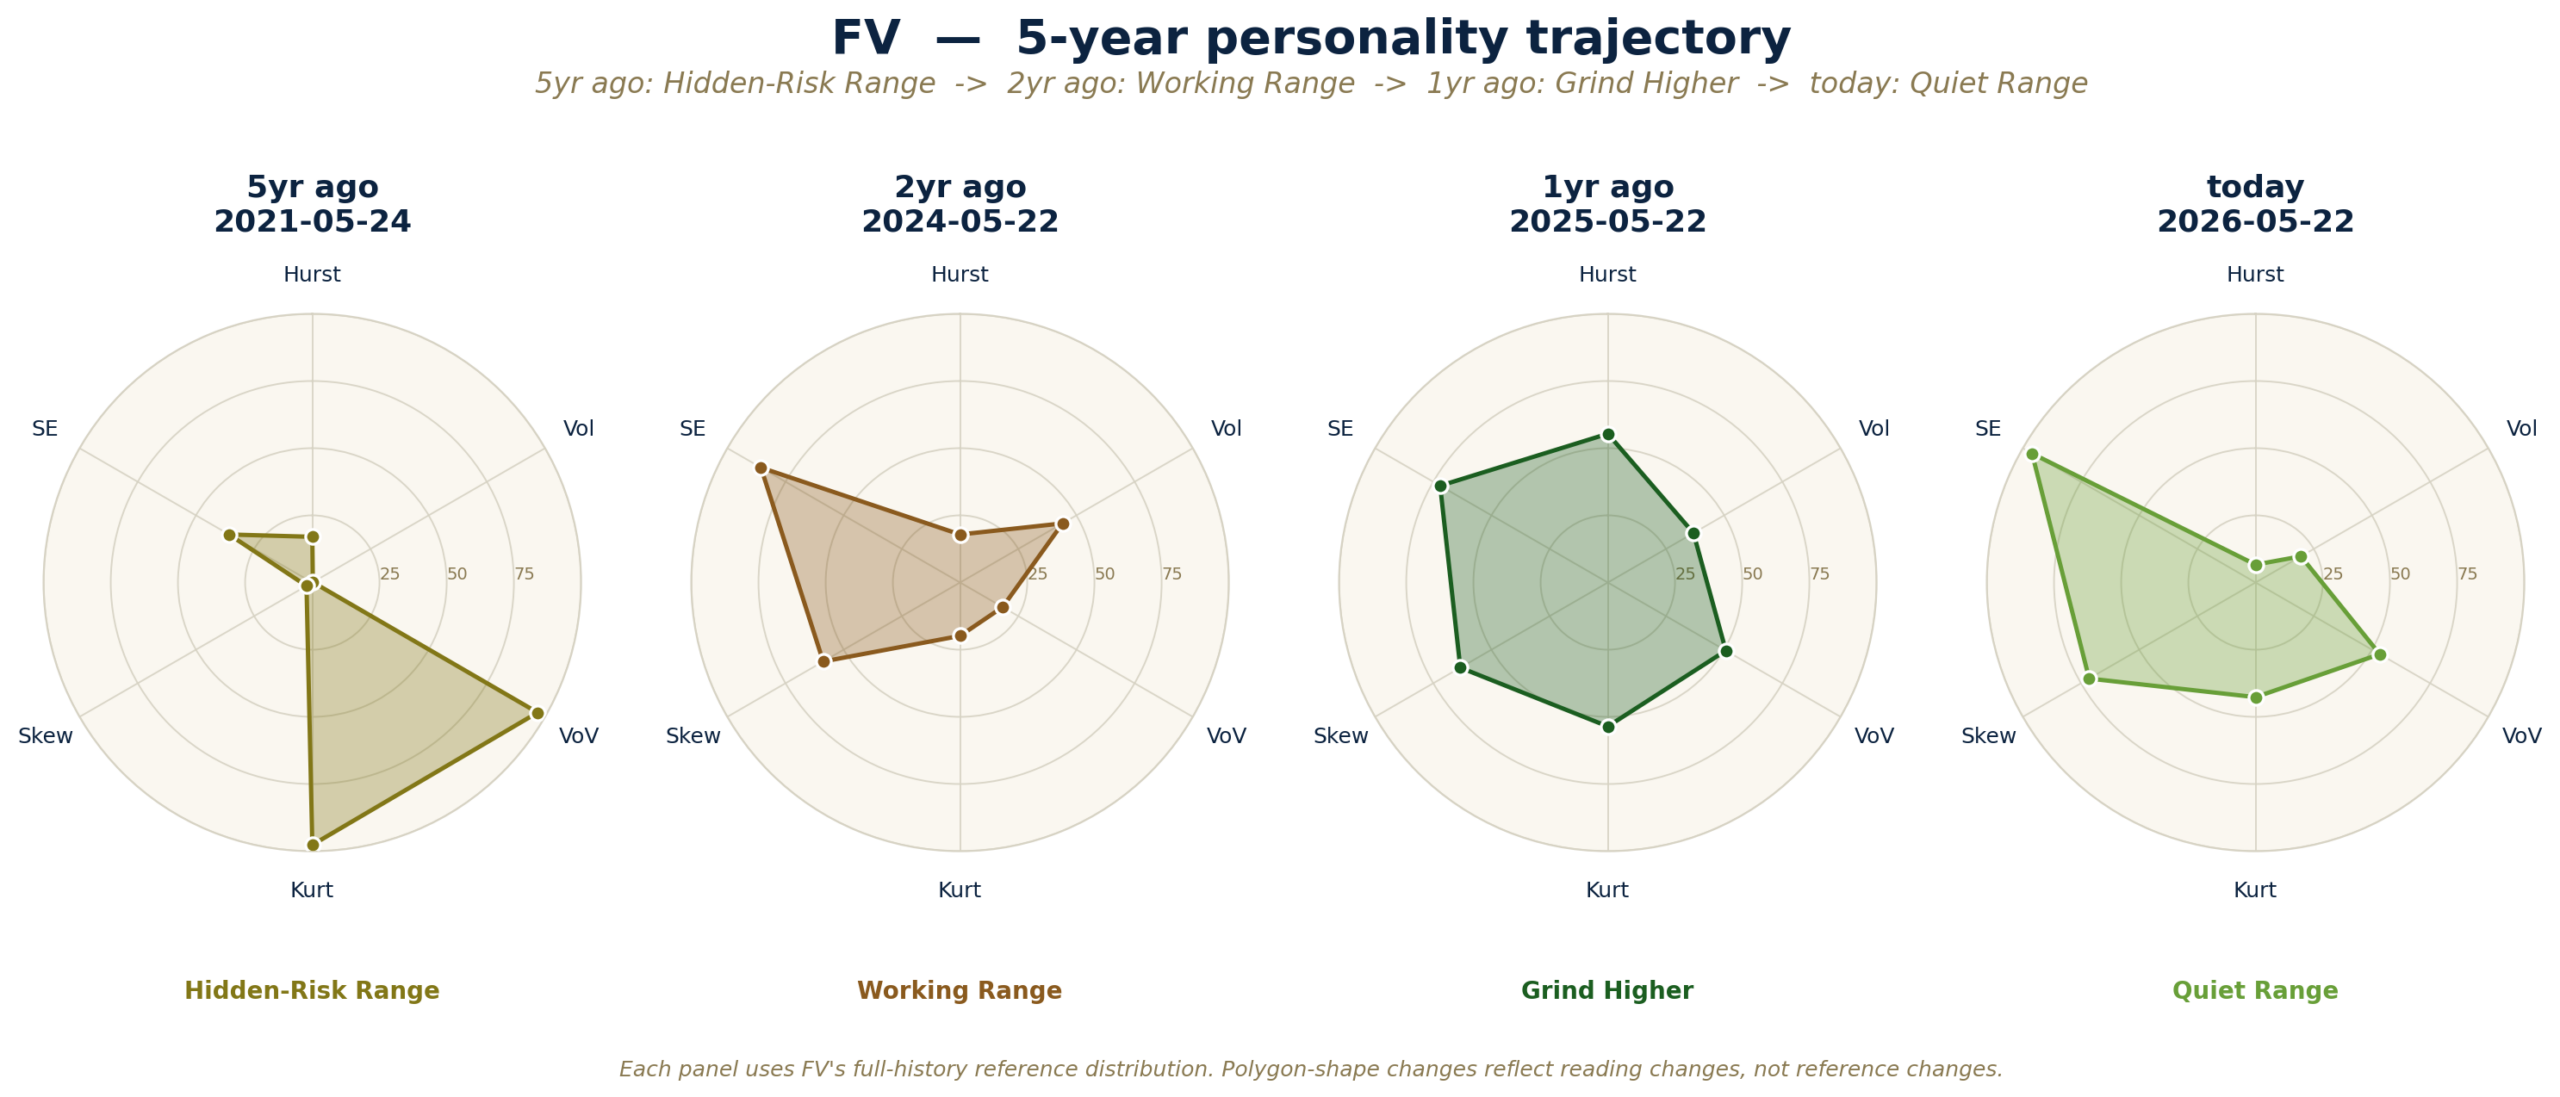
How to read it: a growing polygon means the market is heating up on those traits. A shrinking polygon means it’s cooling off. Big label changes between frames (e.g. Healthy Trend → Full Crisis) are the real regime shifts worth paying attention to.
Current-state scorecard
Here’s the full read — all 16 traits we track, measured over four lookbacks (1 year, 2 year, 5 year, lifetime). Each number is a percentile: how today’s reading ranks against this market’s own history over that window. BIG 6 tags the six traits that drive the radar chart above. Use the arrow column to see whether each trait is rising, flat, or falling vs its 2-year distribution.
← swipe horizontally on mobile to see all columns.
Trend column: ↑↑ strongly rising vs 2-year distribution, ↑ rising, → flat, ↓ falling, ↓↓ strongly falling. Thresholds are 0.5 and 2.0 standard deviations. Percentile ranks use the full lifetime distribution — a 70th-percentile reading means today is higher than 70% of all observed days. The 1-year column uses only ~252 days and should be read as a short-term signal, not a precise rank.
37-year history
Three ways to look at FV’s full 37 years of personality. First chart: every Big-6 trait over time, with the “normal range” shaded in cream and the big macro events (crashes, policy pivots, crises) marked. Second chart: the whole 37 years compressed into one map so you can see how the market has moved through regime-space. Third chart: a month-by-month color calendar of which archetype FV was in — scroll it like a weather map of the market.
Coverage: 1989-11-30 to 2026-05-22 · 9,176 daily observations.
Feature history
One panel per Big-6 trait, over all 37 years. Hover any point for the exact reading. Drag the bar at the bottom to zoom into a specific era (e.g. 2008, 2020). The cream band is the p10-p90 envelope — the middle 80% of all-time readings. Treat it as a “normal zone” with a caveat: markets with fat tails routinely visit the extremes, so a value outside the band isn’t anomalous, just historically unusual. Triangles along the top mark major market events (structural breaks — crashes, policy turns, war); hover to see each one.
Personality map
This map shows where FV has lived over 37 years. The shaded region is a density map — darker patches are where the market has spent most of its time. The labeled circles (1990s, 2000s, 2010s, 2020s) are decade medians, color-matched to time (navy = early, gold = recent). The gold diamond is today, with the exact reading. Left-to-right is how strongly the market was trending (right = more trend, left = chop). Up-down is how volatile it was vs FV’s own history (0 = quiet, 100 = extreme). Read it as: is today close to where the market usually lives, or at the edge of unfamiliar territory?
Regime calendar
Every month of FV’s life, labeled as one of 12 personality types (combinations of volatility, trend, and tail risk). Each color is one archetype — the legend below the chart ranks archetypes by how much of the history the market has spent in each. Hover any band to see the exact month and archetype. Triangles are the same macro-event annotations from the first chart.
Methodology
The 16 traits. We group them into four families (click any underlined term for a quick definition):
- Trend traits (does the market keep going in one direction?): Hurst exponent (R/S estimator), variance ratios, ADF p-value, OU half-life, lag-1 autocorrelation.
- Volatility traits (how big are the daily swings, and are they sticky?): annualized vol (std dev of daily log returns, rolling 252-day window, scaled by √252), vol-of-vol, GARCH(1,1) persistence.
- Shape traits (are the tails fat? which side are shocks on?): skewness, excess kurtosis (Fisher), leverage correlation.
- Complexity traits (is the price path noisy or clean? do cycles repeat?): sample entropy, spectral entropy, fractal dimension, rolling max drawdown.
How we pick the archetype. Three pieces — volatility level, trend strength, tail risk — combine into a 12-box grid of personality types. We use FV’s own history (not a cross-market ranking), so a quiet market and a wild market can both be scored fairly against themselves. The classifier reads exactly three of the sixteen traits (Hurst percentile, annualized-vol percentile, kurtosis percentile) through hand-set thresholds. The other 13 traits inform the scorecard but not the archetype label.
How to read a percentile. “70th percentile vol” means today’s vol is higher than 70% of FV’s own history — NOT higher than 70% of other markets. Every number on this page is scored against FV itself. Cross-market comparisons live on the personality clusters page.
Caveats worth knowing.
- Percentile series look ahead. Readings on the feature-history chart are ranked against the market’s full lifetime, including data after the x-axis date. A 2008 reading at the 90th percentile is high relative to what we now know of history, not relative to what was known in 2008. This is a snapshot characterization, not a point-in-time rank series.
- The archetype classifier reads only 3 of 16 traits. Features like skewness, entropy and the complexity family feed the scorecard but not the label.
- Hurst is a structural measure, not a daily-trend signal. Hurst > 0.5 indicates long-memory in the 252-day rolling return series — useful for characterizing regime. It does NOT reliably predict positive next-day return autocorrelation. Our in-house empirical test on 37 years × 18 markets found no such link. Don’t read a “trending” Hurst label as a day-trading signal.
- Rule-based classifier. Thresholds are hand-set. The classifier does not learn from alert performance (that lives in TA Profile).
- Short-window instability. 1-year percentiles use ~252 days; on recently-listed markets (e.g. BTC) they are noisier than lifetime stats. Read the Lifetime column when confidence matters.
- Rolling windows lag sharp breaks. Expect feature readings to lag sharp regime breaks by a few bars.
- Event markers are hand-curated. The triangles on the feature history and regime calendar are macro-event annotations, not the output of a change-point detection algorithm. Alignment between an event and a visible shift on the chart is for reference, not a statistical claim.
Full plain-English definitions for every feature in the Feature glossary.
Related
- Market Personality hub — back to the market index.
- Personality clusters — both the structural map and today’s state map across all live markets.
- Feature glossary — plain-English definitions for all 16 features.
- Live risk-state detector (Phase 4 continuous stress score) — coming soon.