
Seasonal Accuracy Charts: Australian Dollar (AD)
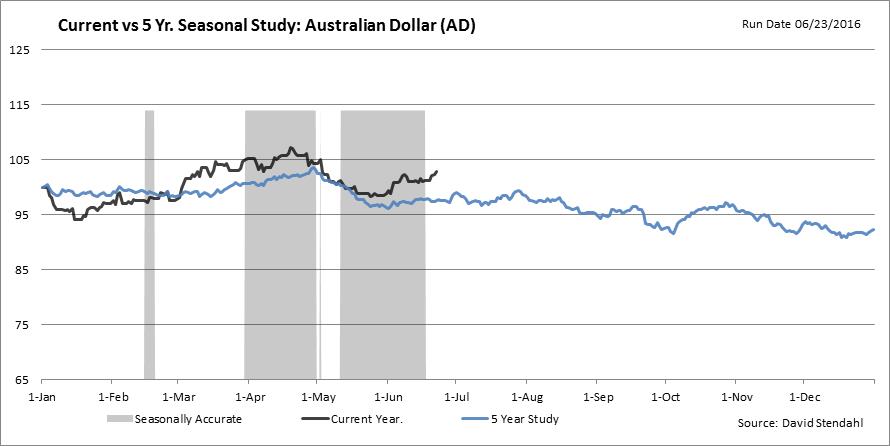
These seasonal charts provide a quick comparison between current year data (black line) and the markets historical 5/10/15/20-year seasonal study (blue line). The vertical gray area (if shown) indicates when and for how long the current year data correlates with the seasonal study. These seasonal charts should be used as a historical reference of past trends and turning points and not as buy/sell recommendations … past performance is not indicative of future results.


Seasonal Overview
Take a look at these seasonal charts to gain additional insight into the seasonal tendencies of the Australian Dollar.
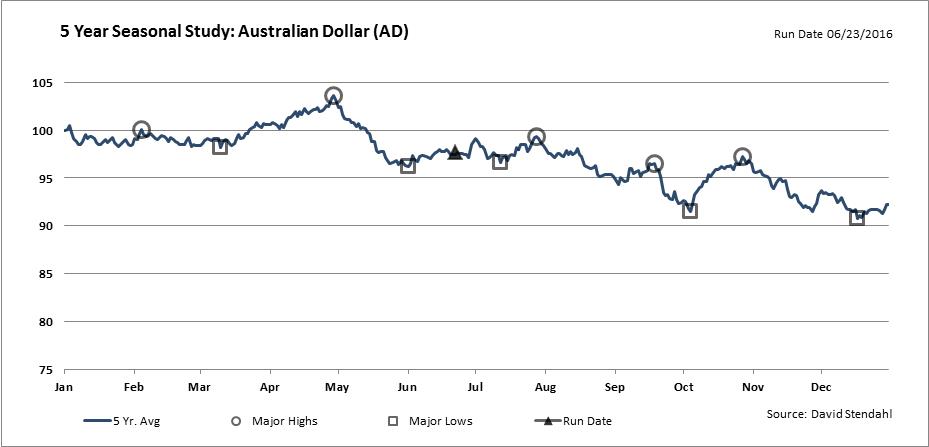
Step 1: Turning Points
Step 2: Accuracy
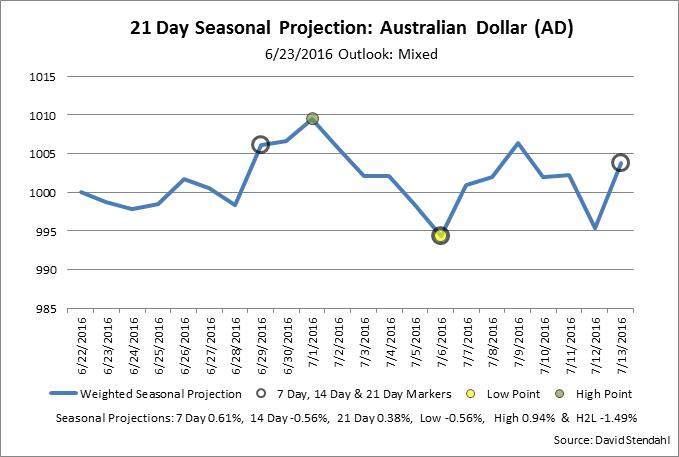
Step 3: Projection
Step 4: Sector Review
Click on the links or any of the four charts for greater detail.


Seasonal Projection
Measuring opportunity
If the market is tracking its seasonal tendencies ... it's time for a projection.
Seasonal Projection