
Risk/Reward Bubble Charts: 18 Month Analysis
Bubble Chart Overview:
- Vertical X-axis = Percent Return
- Horizontal Y-axis = Market Correlation vs the S&P 500
- Bubble Size Z-axis = Daily Standard Deviation of Return (Volatility)
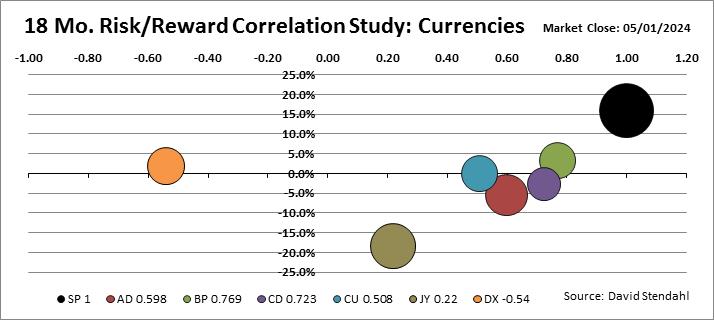
SP: S&P 500 Index
AD: Australian Dollar
BP: British Pound
CD: Canadian Dollar
CU: Euro
DX: U.S. Dollar
JY: Japanese Yen
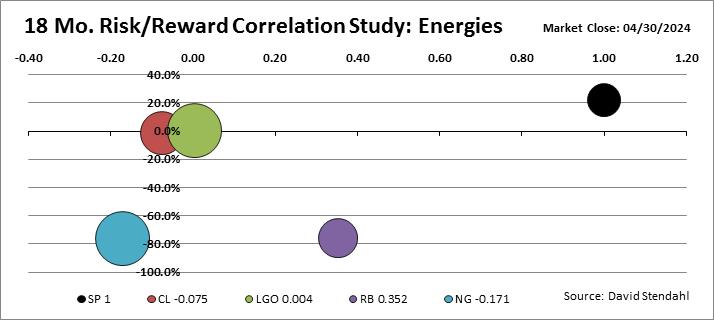
SP: S&P 500 Index
CL: Crude Oil
LGO: London Gas Oil
RB: RBOB Gasoline
NG: Natural Gas
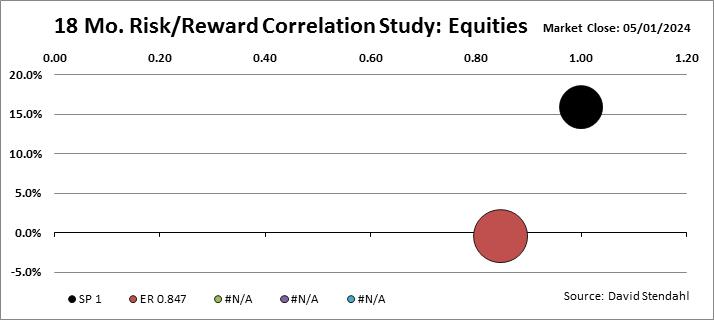
SP: S&P 500 Index
TF: Russell 2000
FDX: German DAX
FCH: Paris CAC-40
HSI: Hang Seng
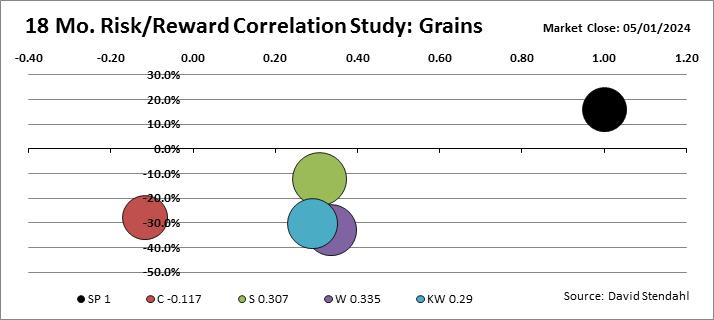
SP: S&P 500 Index
C: Corn
S: Soybeans
W: Wheat
KW: Kansas City Wheat
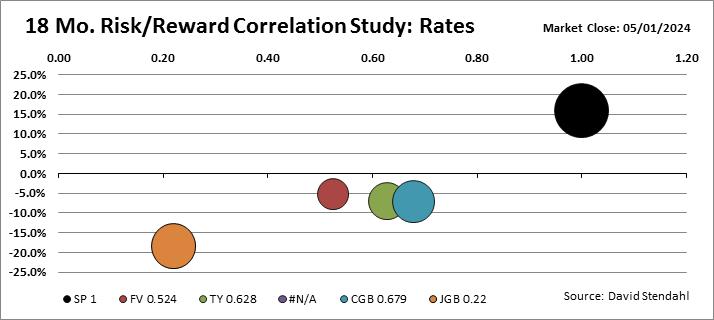
SP: S&P 500 Index
FV: Five Year Notes
TY: Ten Year Notes
EBL: Euro Bund
CGB: Canadian Govt Bonds
JGB: Japanese Govt Bond
SP: S&P 500 Index
LC: Live Cattle
LH: Lean Hogs
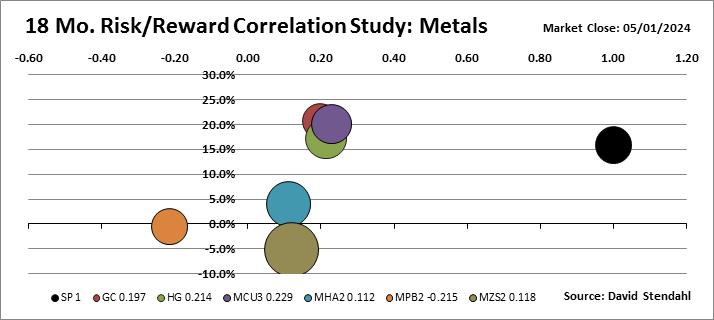
SP: S&P 500 Index
GC: Gold
HG: Copper
MCU: LME Copper
MHA: LME Aluminum
MPB: LME Lead
MZS: LME Zinc
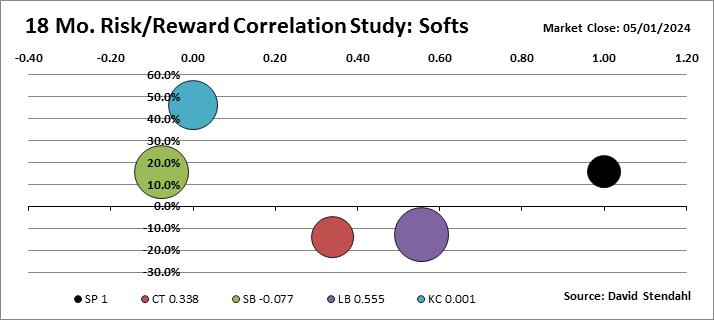
SP: S&P 500 Index
CT: Cotton
SB: Sugar
LB: Lumber
KC: Coffee
Seasonal Projection
Measuring opportunity
If the market is tracking its seasonal tendencies ... it's time for a projection.
Seasonal Projection